R-FCN
last modified : 13-06-2019
General Information
- Title: R-FCN: Object Detection via Region-based Fully Convolutional Networks
- Authors: Jifeng Dai, Yi Li, Kaiming He, Jian Sun
- Link: article
- Date of first submission: 20 May 2016
- Implementations:
Brief
This network uses a two-stage object detection strategy, first the region proposal step followed by region classification. According to the paper, they can go 2.5 to 20 times faster than a Faster R-CNN with the ResNet-101 and get results of 83,6% of mAP on the PASCAL VOC 2007 and 82,0% on the 2012.
How Does It Work
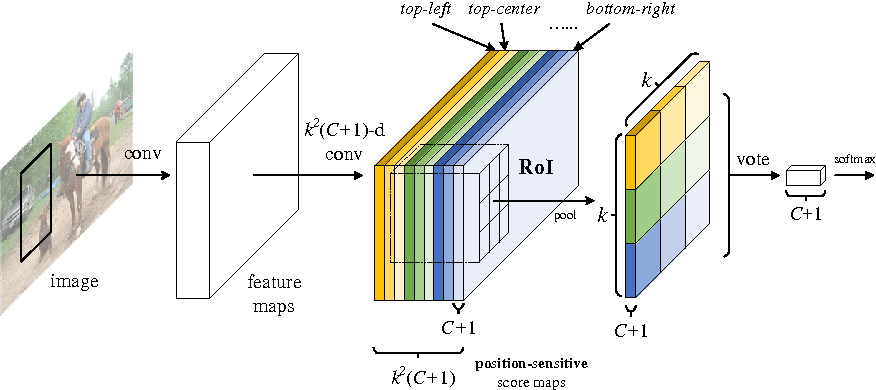
The architecture of the network is kind of the same as the architecture of the Faster R-CNN and can be split in two parts. The image below (taken from the article) shows the architecture of the network with the two parts:

The first part is the RPN which is the same network as the one used in the Faster R-CNN.
Then for the second part, the feature maps are given to convolutional layers, to create a set of filter which will indicate the class of each cell in the grid. These filters are then use to vote for the class of a given RoI. Also, it is not shown in the diagram, but there is a second set of layers used to do some regression and approximate the real value of the boxes.
Results
In the article, they report various experiments, which will not be shown here. Only the final results for the VOC challenges are shown here.
- PASCAL VOC 2007
(multi-sc train = multi-scale training)
| Network | training data | mAP(%) | test time (sec/image) |
|---|---|---|---|
| Faster R-CNN | 07+12 76.4 0.42 | ||
| Faster R-CNN +++ | 07+12+COCO | 85.6 | 3.36 |
| R-FCN 07+12 | 79.5 | 0.17 | |
| R-FCN multi-sc train | 07+12 | 80.5 | 0.17 |
| R-FCN multi-sc train | 07+12+COCO | 83.6 | 0.17 |
- PASCAL VOC 2012 (07++12 denotes 07 trainval + test and 12 trainval)
| Network | training data | mAP(%) | test time (sec/image) |
|---|---|---|---|
| Faster R-CNN | 07++12 | 73.8 | 0.42 |
| Faster R-CNN +++ | 07++12+COCO | 83.8 | 3.36 |
| R-FCN multi-sc | train07++12 | 77.6 | 0.17 |
| R-FCN multi-sc | train07++12+COCO | 82.0 | 0.17 |
In Depth
Lets detail the last part of the network, the ROI + vote.
Taken from the paper, this diagram describes in details the last part of the network:

From now on, "cells layers" will refer to the colored layer obtained from the feature maps after the last convolutions.
The idea is the following, the RoIs are cut down into N bins (here k*k), each of these bins correspond to one of the cell of the cells layers. This way, to each bin of the ROI a class is assigned. Finally, from those N bins, the final class is voted.
Now, how are the different scales handle ? A RoI that is half the size of the image will have more cells from the cells layers than it has bins in it (a fixed number of k*k). Each bin is match to the closest cell in the cells layers, this means that there is some "holes" when classifying big objects and overlapping cells when classifying small ones.